
A Quick Tour of the Learning Interpretability Tool
The Learning Interpretability Tool (LIT) is a modular and extensible tool to interactively analyze and debug a variety of NLP models. LIT brings together common machine learning performance checks with interpretability methods specifically designed for NLP.
Building blocks - modules, groups, and workspaces
Modules, groups, and workspaces form the building blocks of LIT. Modules are discrete windows in which you can perform a specific set of tasks or analyses. Workspaces display combinations of modules known as groups, so you can view different visualizations and interpretability methods side-by-side.
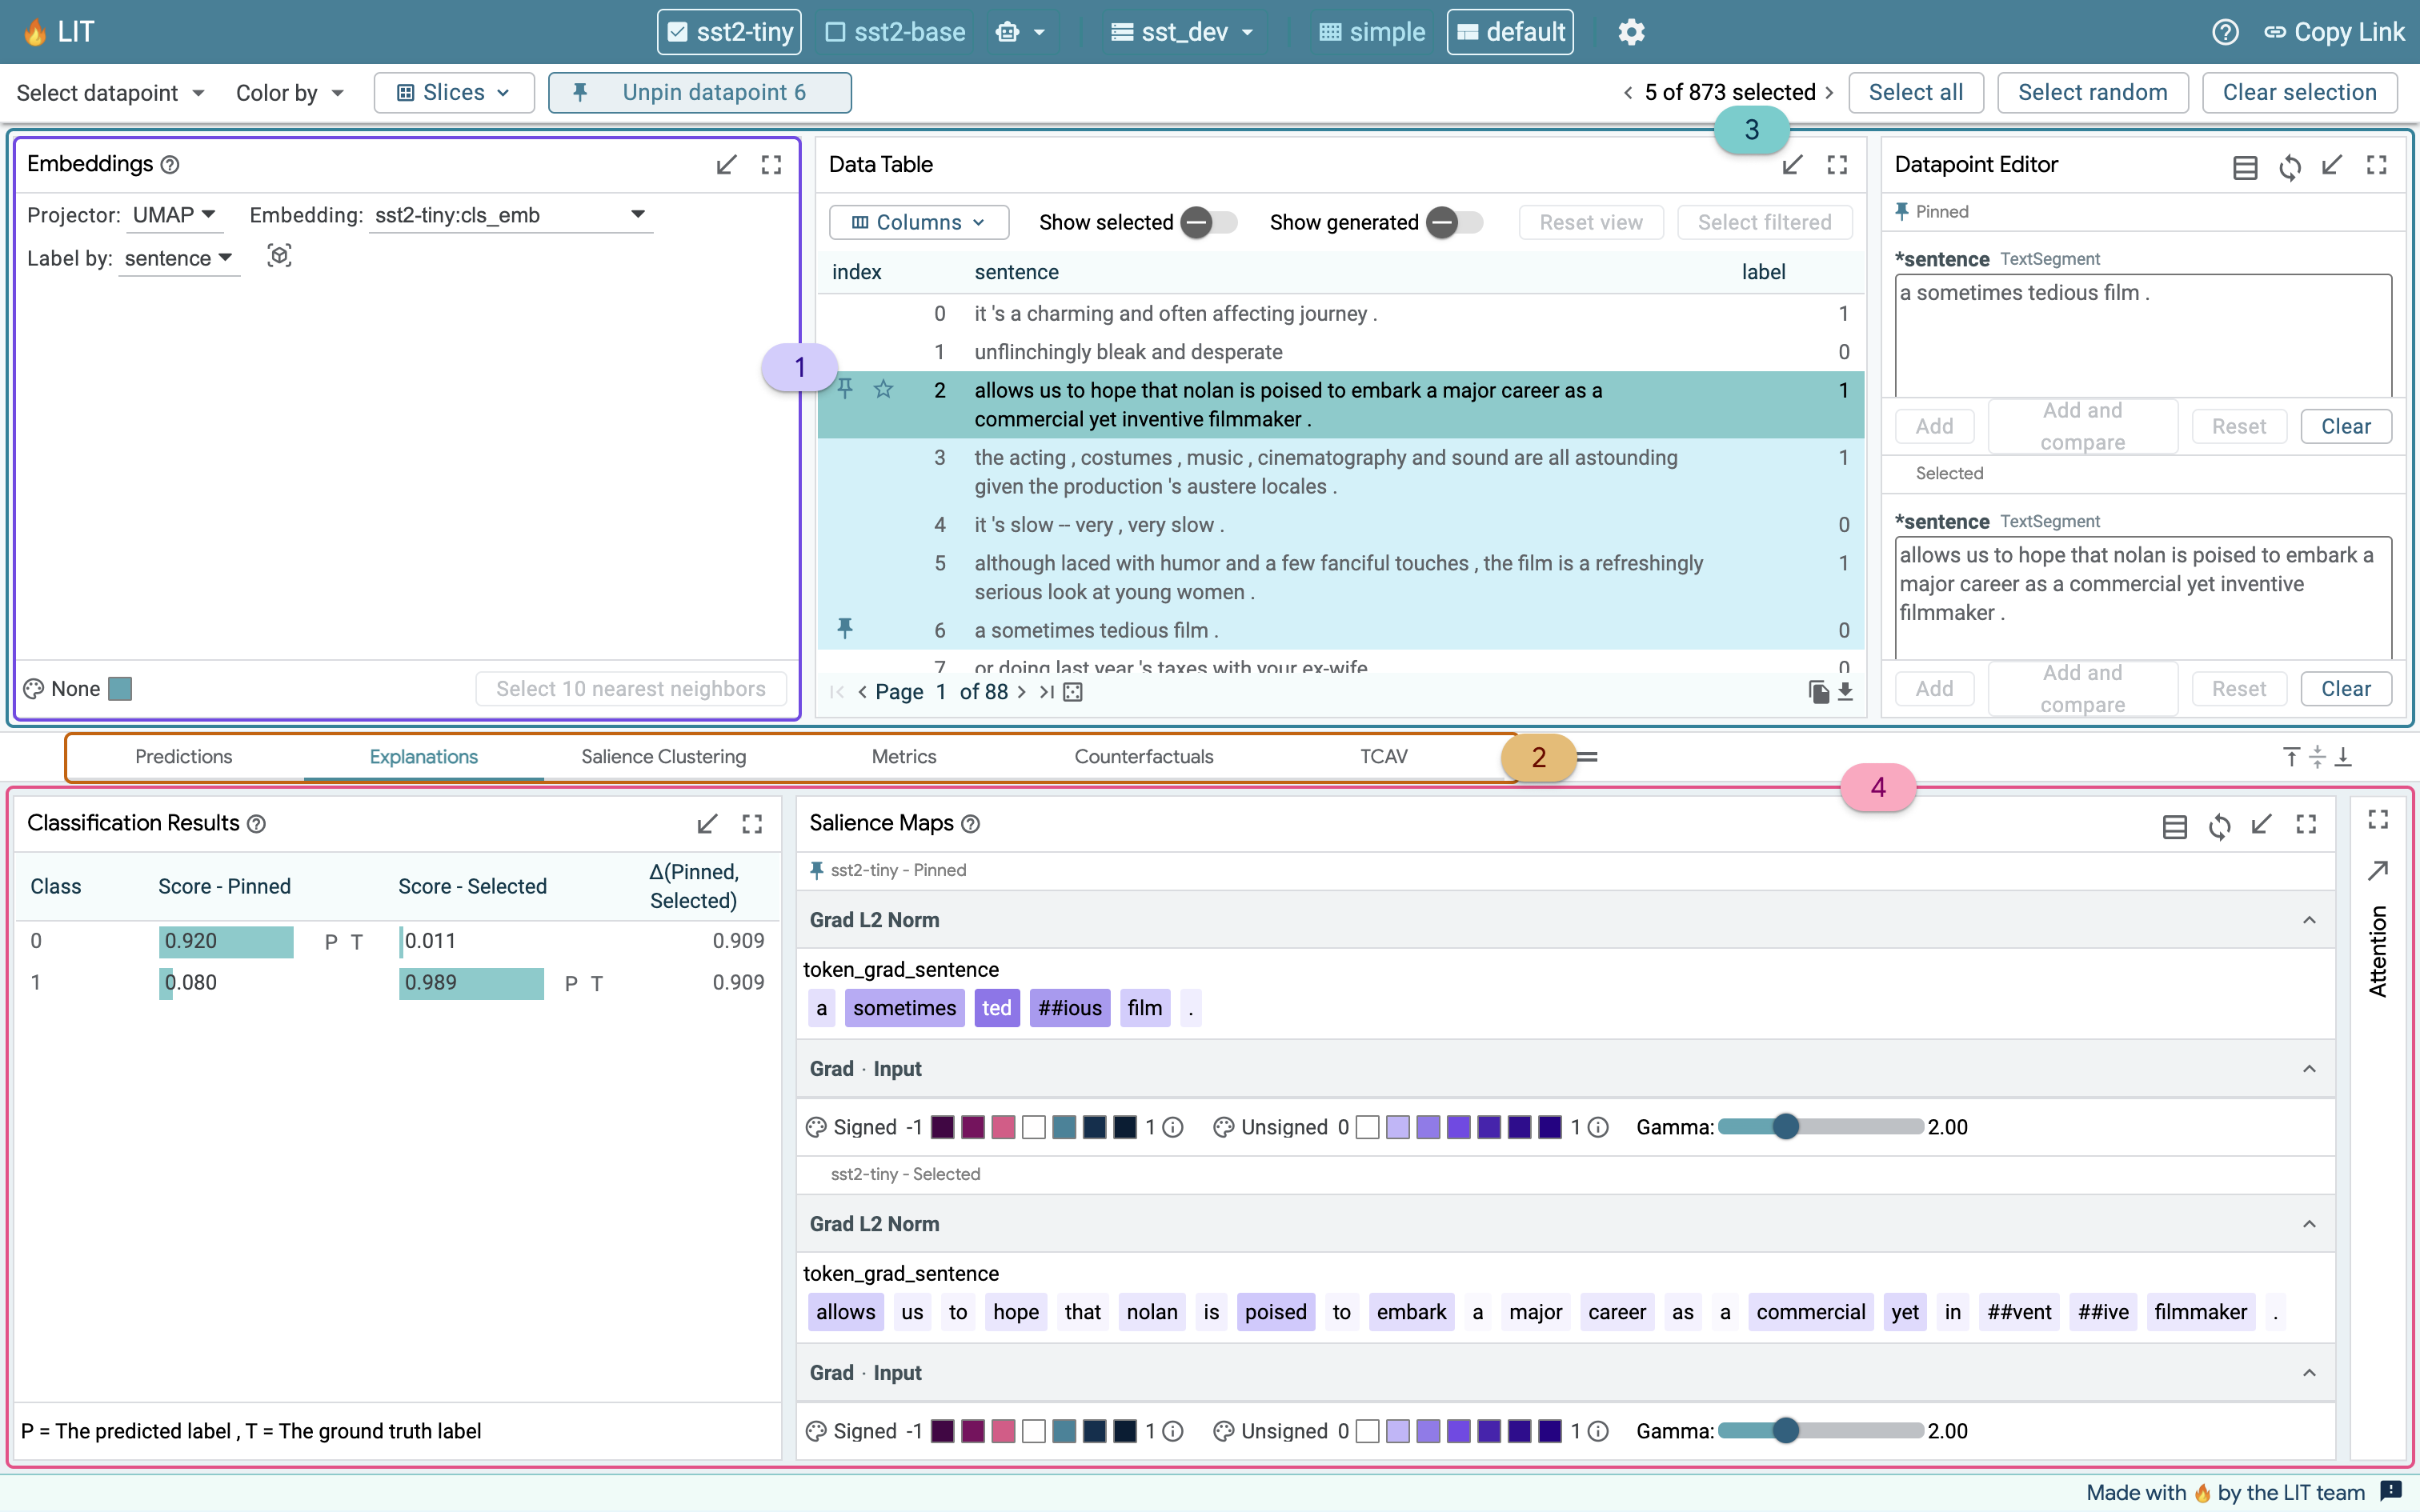
LIT is divided into two workspaces - a Main workspace in the upper half of the interface, and a Group-based workspace in the lower half.
The Main workspace contains core modules that play a role in many analyses. By default, these include:
- Embeddings - explore UMAP and TSNE embeddings from your model.
- Data Table - explore, navigate, and make selections from your dataset.
- Datapoint Editor - deep-dive into individual examples from your dataset.
- Slice Editor - create and manage slices of interest from your dataset through your LIT session.
In the Group-based workspace, modules that offer related insights are organized together under tabs. By default, LIT offers a few default groups based on common analysis workflows: performance, predictions, explanations, and counterfactuals.
- Use the Performance group to compare the performance of models across the entire dataset, or on individual slices.
- Explore model results on individual data points in the Predictions group.
- Investigate salience maps and attention for different data points in the Explanations group.
- Generate data points using automated generators in the Counterfactuals group, and evaluate your model on them instantly.
You can organize modules into groups and define your own layout when you set up your LIT server.
Toolbars
At the very top, you’ll see the LIT toolbar. Here, you can quickly check which models have been loaded, configure LIT, or share a URL to your session. Below that is a toolbar which makes it easier to perform actions applied across all of LIT. Here you can:
- Select data points by relationship, or by slice.
- Choose a feature to color data points, across all modules.
- Track the datapoint you are looking at, navigate to the next, mark a datapoint as a favorite, or clear your selection.
- Select the active models and dataset, including multiple models to compare.
The footer at the very bottom of the interface will display any error messages. If anything goes wrong, you can also use the feedback button to let us know on GitHub.
Using Modules
LIT makes it easy to interact within and across modules. Many modules in LIT have their own toolbars which contain controls and selections for that module. The results of actions performed in one module can impact other modules. For example, if you select five data points in the Data Table module, other modules (such as the Scalars module) will respond to your selection. Similarly, the active selection, no matter where it was triggered from, can be saved as a slice in the Slice Editor. Model performance for this new slice will now show up in the Metrics module.
Finally, you can easily expand and collapse individual modules using the icons on the top-right of each module.
Now that you are familiar with LIT’s interface, take LIT for a spin in our demos or explore different case studies.


