A Tour of the What-If Tool
The What-If Tool is a visualization-based tool to probe the behavior of trained ML models. This article provides a quick walk through of what to expect when getting started in the What-If Tool. Learn about the basic layout and some key functionalities of the What-If Tool.

Tabs
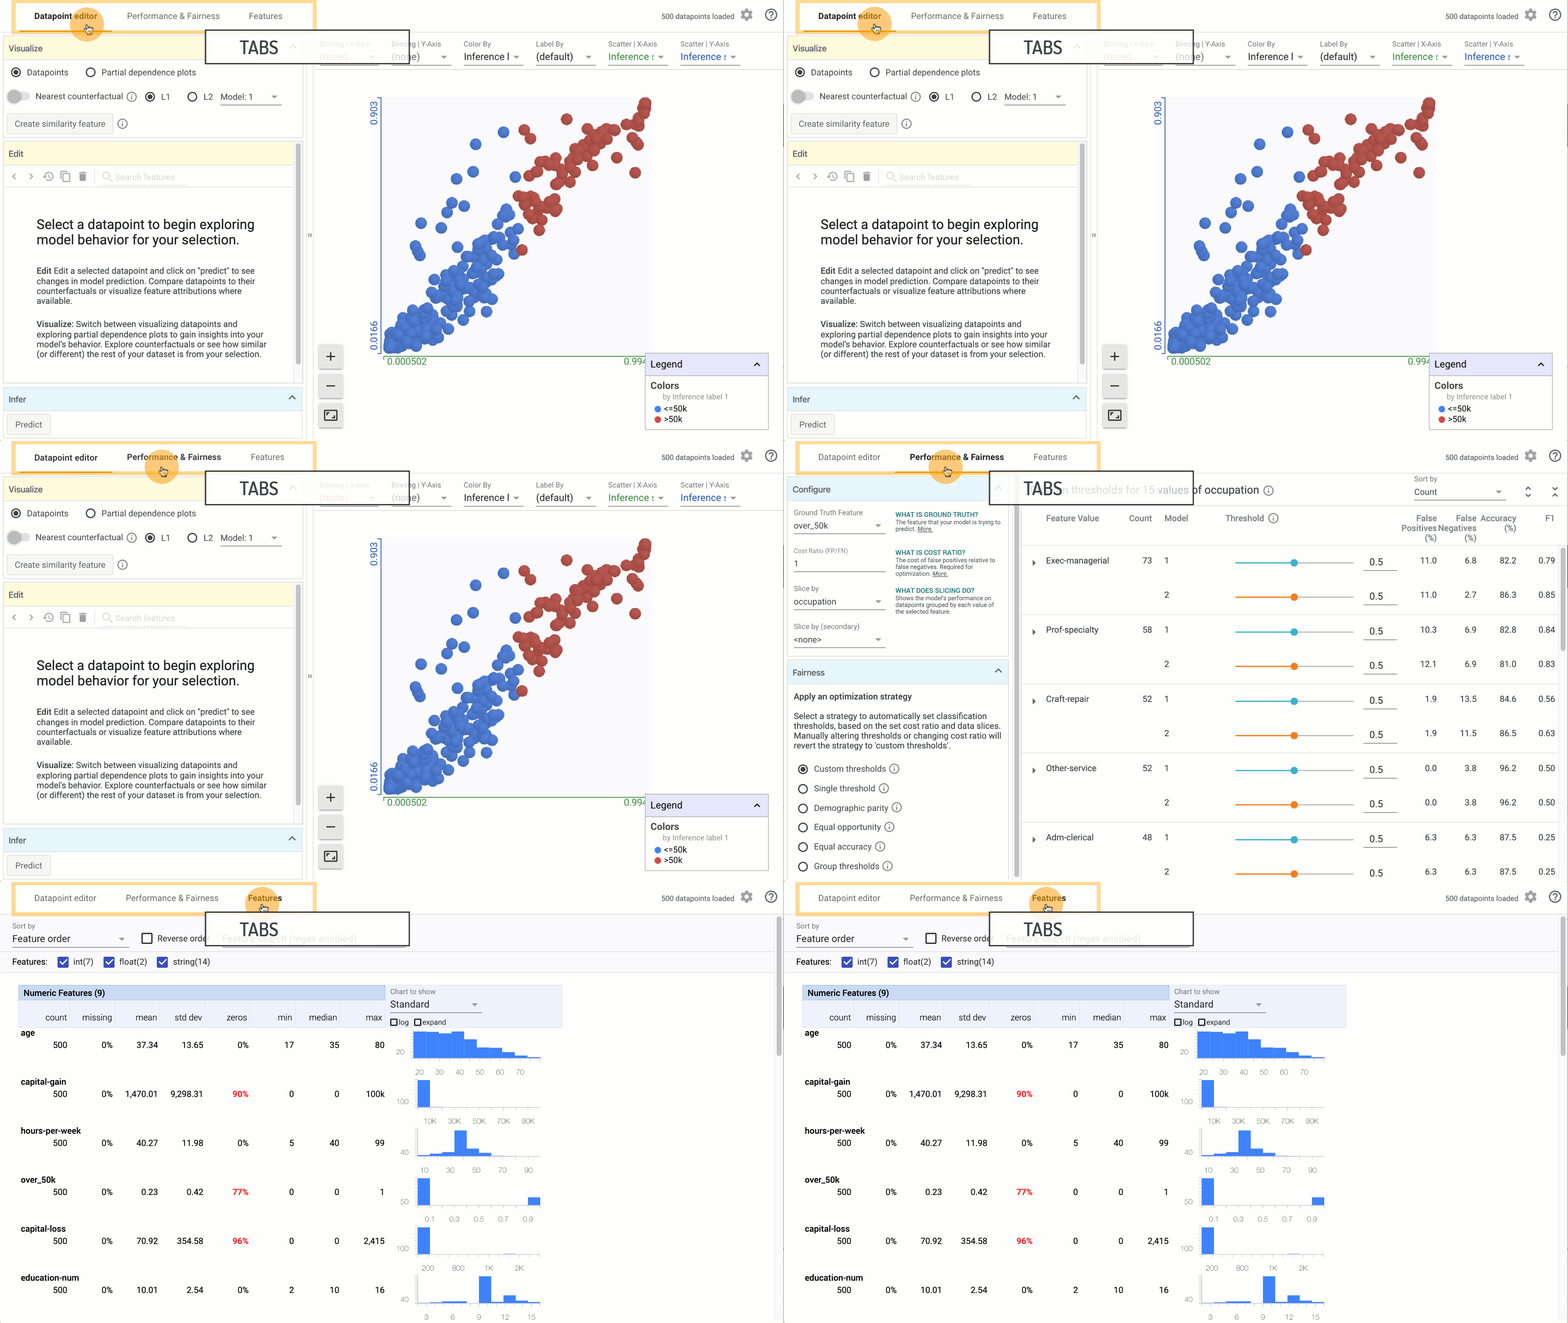
The interface of the What-If Tool is organized by three tabs, which are based on the kind of models loaded into the What-If Tool. Tabs are interactive elements that can be used to navigate into different areas of the What-If Tool, located in the top-right hand side of the interface:
- Datapoint Editor. by default, the What-if Tool will always open in this tab.
- Performance for multi-class and regression models or Performance and Fairness for binary classification models
- Features Overview

Workspaces
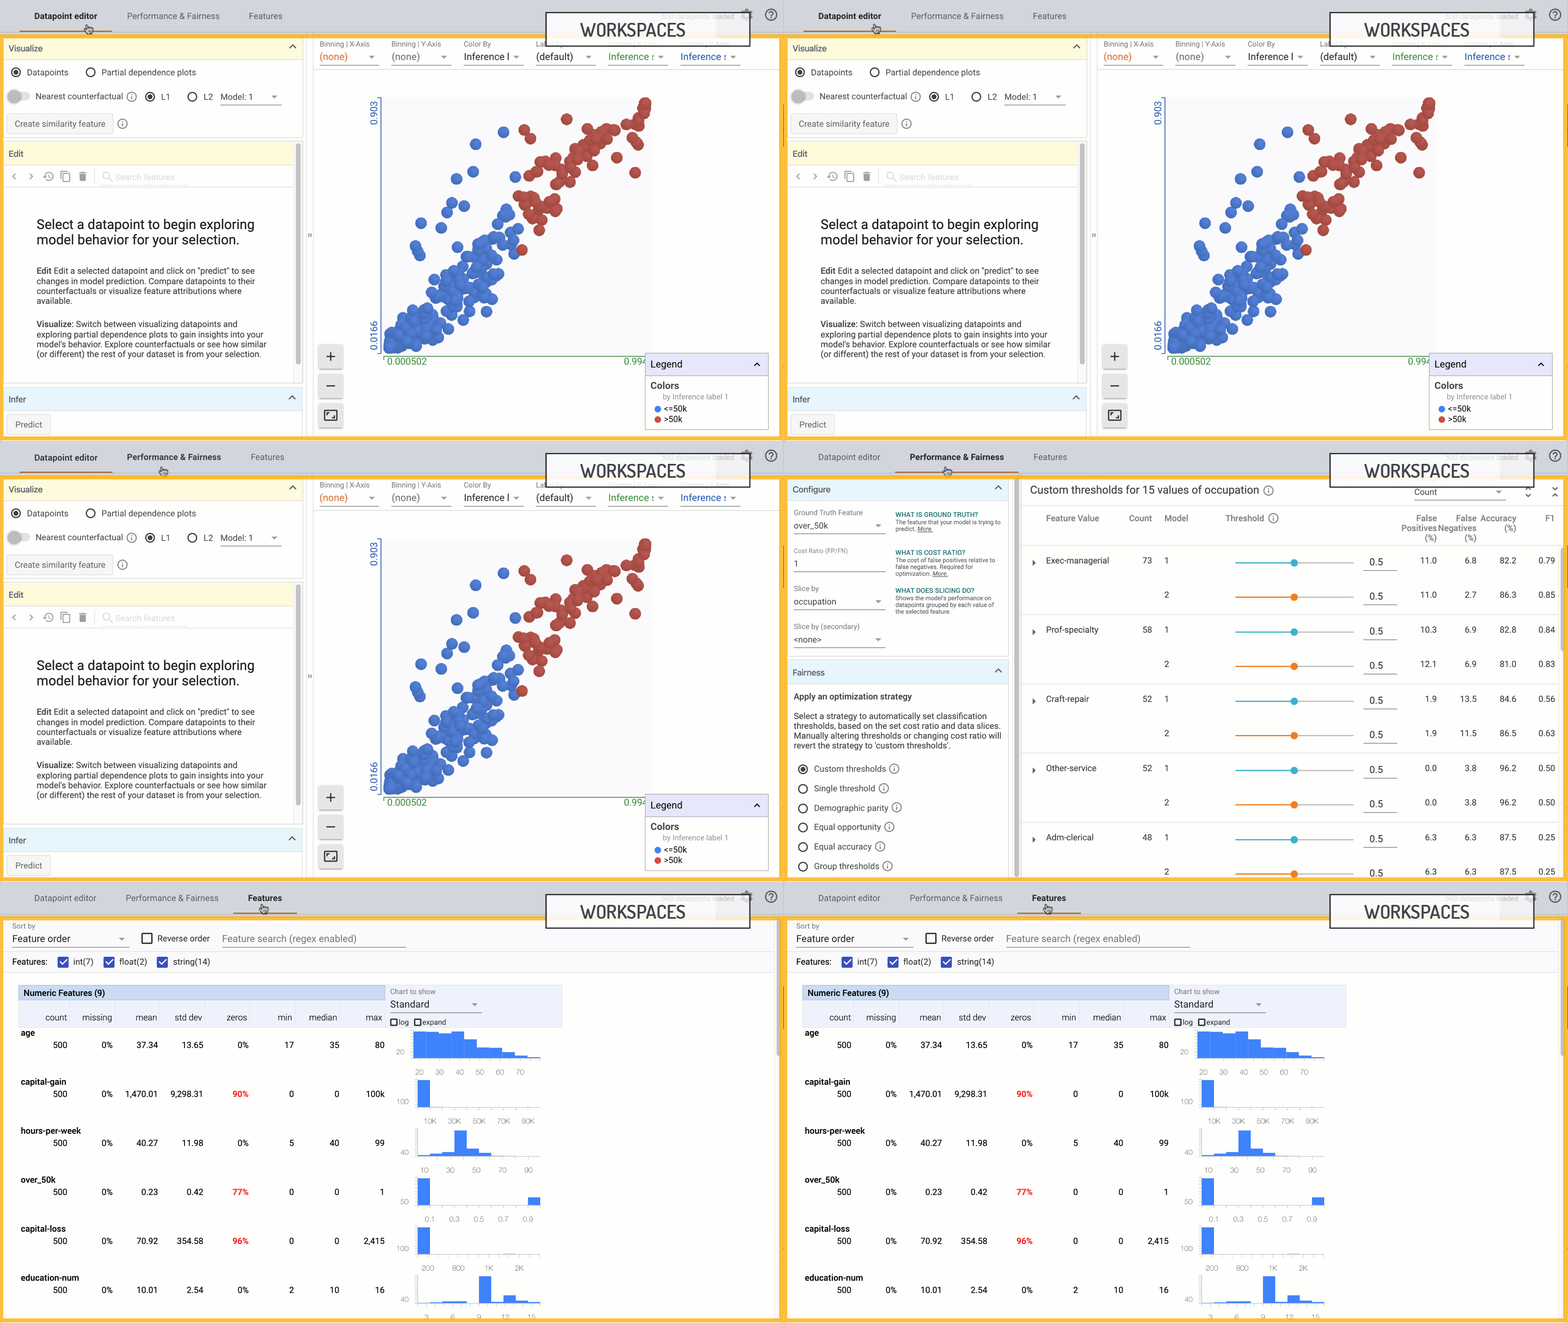
Clicking on a tab opens up a corresponding workspace — environments in which different model understanding tasks can be performed. Each workspace offers a group of complementary analyses for individual data points, models, or features.

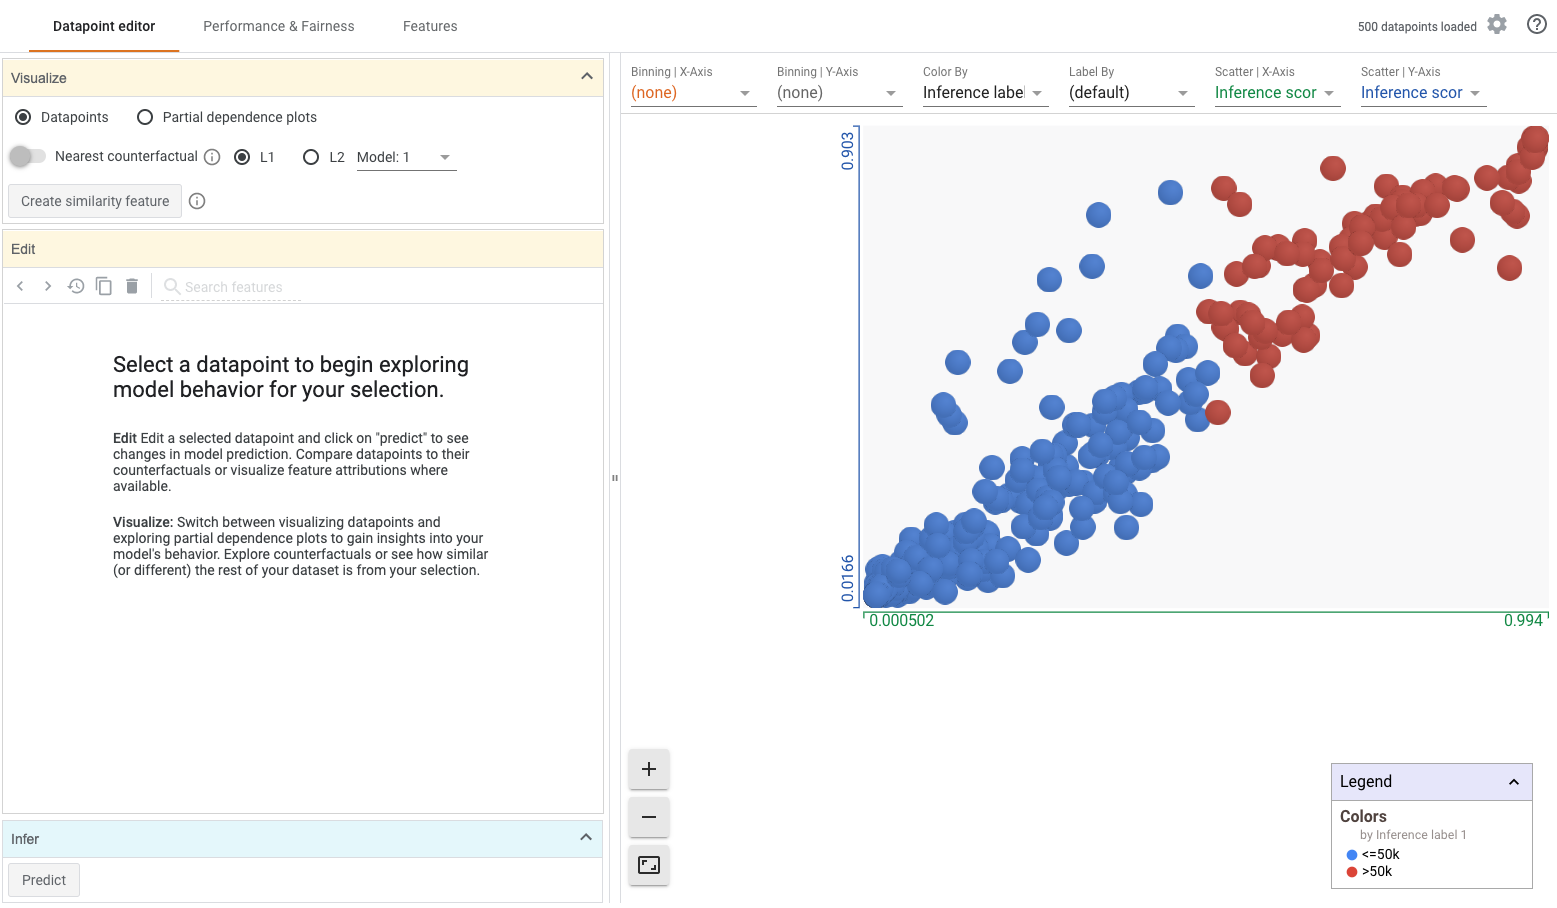
In the Datapoint Editor, individual data points can be arranged into custom visualizations. Data points can also be edited to see if predictions change, and compared to their counterfactuals. Partial dependence plots indicate a model's sensitivity to a feature value in that data point.
In the Performance workspace, high level model performance can be evaluated using feature-based slices in the data set.
In the Performance and Fairness workspace for binary classification models, high level model performance can be evaluated using feature-based slices in the data set. Additionally, threshold values for individual slices and models can be tweaked for different performance results.
The Features Overview workspace, the distribution of each feature in the loaded dataset is visualized with some high-level summary statistics. This workspace is useful when checking the attributes of the loaded datasets.
Modules and Playgrounds
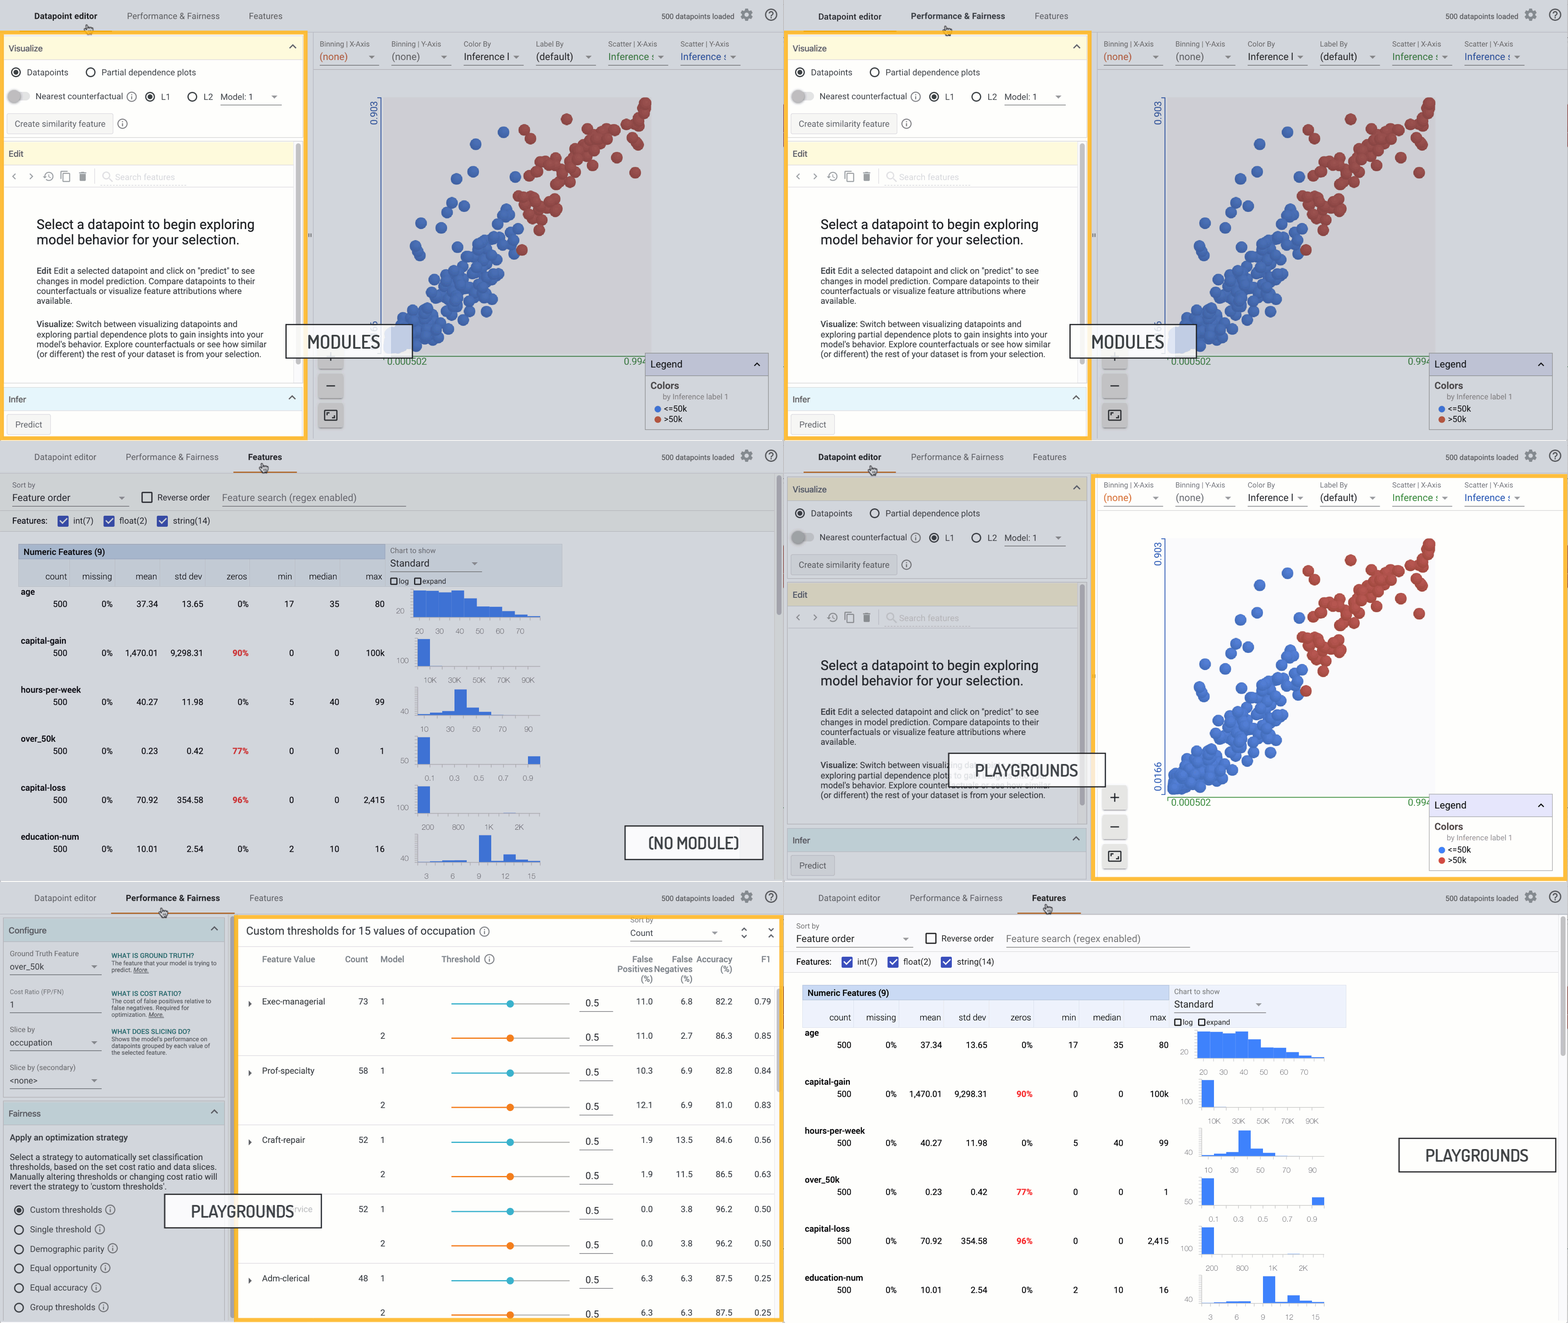
Workspaces typically have two panels. Left hand panels contain several small windows, known as modules. The right hand panel comprises a playground to visualize and probe trained machine learning models.

Each module contains a group of interactive elements to declare workspace-level preferences, apply transformations to elements in the playground, or get back results from a simulation analysis.
The Configure and Visualize modules apply global preferences to the Performance and Datapoint Editor workspaces respectively:
- The Configure module sets variables such as cost ratio and ground truth feature.
- The Visualize module can be used to toggle between different visualization views, and turn on and off functionality such as counterfactuals.
The Edit module (Datapoint Editor workspace) and the Fairness module (Performance & Fairness workspace) can be used to apply transformations or interventions to their respective playgrounds:
- In the Edit module, change any feature value in a data point selected in the Visualization playground.
- In the Fairness module, fairness optimization strategies optimize the thresholds of different slices in the Performance & Fairness playground.
The Infer module (Datapoint Editor workspace) returns the prediction results of a data point which has been edited in the Edit module. It also displays the prediction results for the counterfactual of a selected data point.
Playgrounds are regions to visualize and probe data and model performance. The playground in the Datapoint Editor workspace is used to create custom visualizations of the loaded dataset and view partial dependence plots. The Performance playgrounds display model performance on slices of the dataset in the form of metrics and scores, precision-recall curves and confusion matrices where applicable. The Features Overview playground visualizes the distribution of each feature in the loaded dataset.
Conclusion
This article introduces key aspects of the layout of the What-If Tool - Tabs, Workspaces, Modules and Playgrounds. Together, modules and playgrounds provide the flexibility needed to superimpose different kinds of analyses, and interact across workspaces for better model understanding.


