Exploring Features Overview To Identify Biases
For any supported model type in the What-If Tool, the Features Overview workspace automatically analyzes and visualizes the accompanying dataset, feature by feature. It is created to provide a quick understanding of the underlying distributions of feature values that make up the entire dataset.
Features Overview is particularly useful when trying to identify potential sources of bias in the dataset—bias that could influence model performance in misleading ways.
For example, from the fairness and ethics perspective, stereotyping, prejudice or favoritism towards some things, people, or groups over others are construed as biases. Separately, bias in the mathematical sense is simply regarded as the intercept or offset from an origin that’s present in many machine learning algorithms.
In any scenario, those notions of bias can affect collection and interpretation of data, the design of a machine learning model, and how people interact with the model.
In this tutorial, we refer bias to undesirable, disproportionate outcomes that originate from anything:
- Pre-existing, caused naturally by "the world" that might be reflected in models when using such data. Reporting bias, for example, where one captures the frequency with which people write about actions, outcomes, or properties differently from their real-world frequencies, may pre-exist in many datasets used in model training.
- Co-created, caused by procedures that we might reflect in our data gathering and model development processes. Experimenter bias, for example, where an experimenter continues training models until a preexisting hypothesis is confirmed, is co-created by the practitioner from their model evaluation process.
In this tutorial, the model and accompanying dataset loaded into the What-If Tool was created to predict the likelihood of a person earning an annual income salary over $50,000 based on data from the US Census.
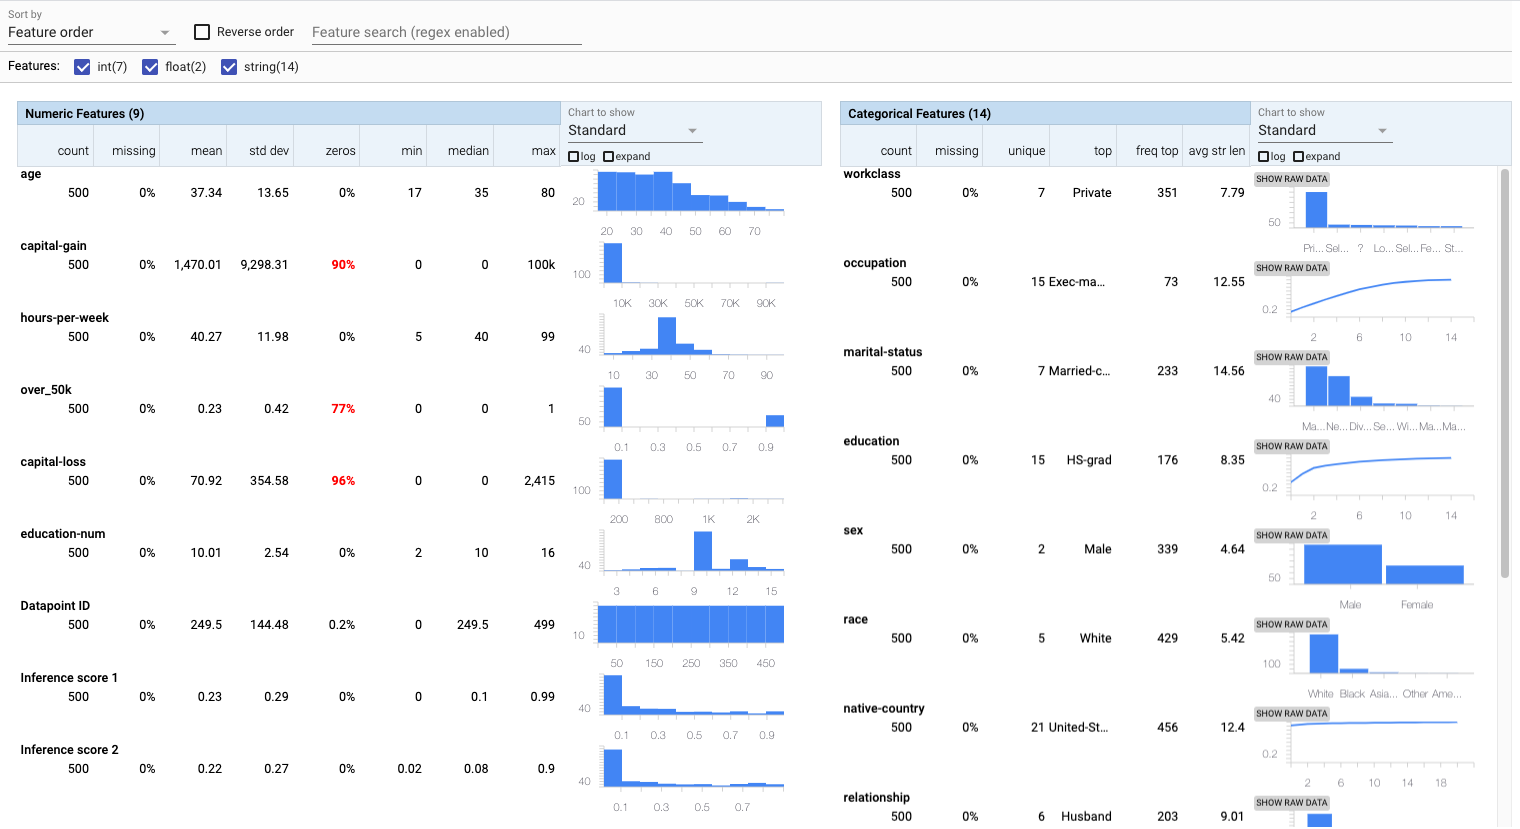
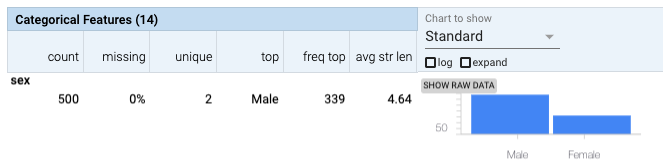
Glancing at the generated histograms in the Features Overview workspace, there is a clear data skew, with males being more prevalent than females by a factor greater than 2:1. Common sense would indicate that the ratio between sexes should be closer to 1. This is confirmed by many estimated measurements. A data skew with such over-representation (approximately 2:1 sex ratio) relative to their real-world prevalence (approximately 1:1 sex ratio) could result in the model being biased.
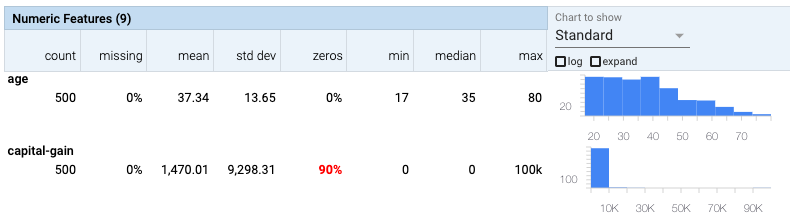
On a similar observation, if the dataset has features with missing or zero values for a large number of datapoints, then that could also be an indicator that certain key characteristics in the dataset are under-represented. The What-If Tool provides a visual cue for the quantity of missing and zero values. Here, marked in red, 90% of the reported capital gain across all datapoints is zero.
Now, capital gain could be indicative of income status as only individuals who make investments register their capital gains and losses. It could very well be the case that, say, only 10% of the US population report capital gain, which means there is nothing to worry about in regards to the abundance of zero values for capital gain. However, what is not entirely clear is how this information—this 90%—should be handled for machine learning purposes. Should these zero values be imputed to the median reported capital gain or some other estimate? Should these zero values suggest that the datapoint should be removed from the dataset for model training purposes? Should these zero values remain unchanged?
Lack of context is always a flag for concern, and one that could trigger fairness-related issues later on.

Exclusive to numerical features, the Features Overview workspace can also visualize the distribution as quantiles instead of histograms, allowing quicker ways in identifying unexpected feature values.
In this running example, most of the hours per week reported in the US Census is centered around 40 as shown in the quantile plot and corroborated in reports. What is peculiar here is a few datapoints reporting work hours per week approaching 100, or over double the reported average time. Concerning, and a bit unexpected, but it does represent just a tiny portion of the dataset. There are not enough datapoints to raise an alarm about problems in data collection or other inaccuracies that could introduce bias—but this is something to be mindful of when moving forward with model training.
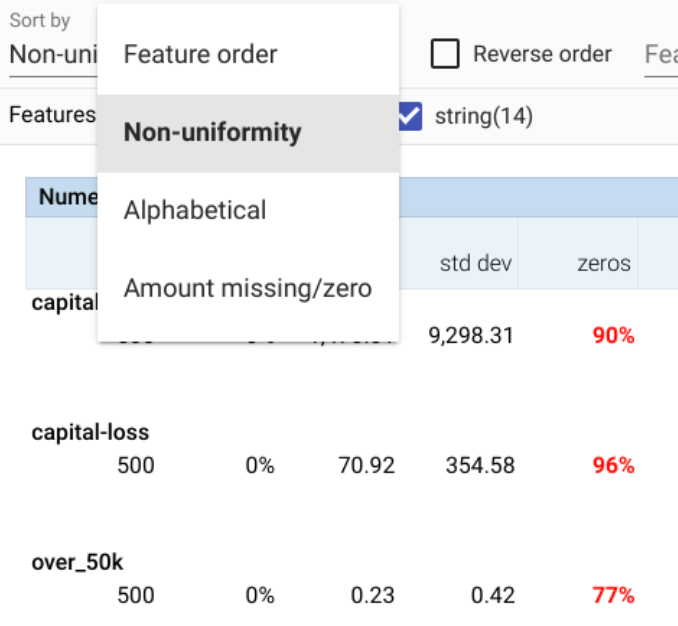
In addition to the options available in the tables themselves, the What-If Tool allows sorting by non-uniformity, among other sorting options. This helps surface features that have the most inconsistency to the top, which may indicate some type of bias, undesirably impacting model performance.
While it can be challenging to identify the very root causes that introduced bias into the dataset and model in the first place, the automatically-generated visual analyzes in Features Overview can help provide hints at pre-existing or procedural conditions.


