Using Custom Prediction Functions
A custom prediction function in the What-If Tool is a python wrapper for your model prediction code that allows you to use WIT with any ML framework, beyond the ones with built-in support. This article will detail when to use a custom prediction function and what it can do, including how it can be used to display feature attributions in WIT. For details on how to configure WIT to use a custom prediction function, check out the TensorBoard setup tutorial or the Notebook setup tutorial, depending on which environment you are running WIT in.
When To Use
WIT has built-in support for a variety of models: TF Estimators, those served by Cloud AI Platform Prediction, and those served by TensorFlow Serving. But, many ML practitioners have models that don’t fit into those constraints, such as Keras models, and those using non-TensorFlow frameworks such as PyTorch, XGBoost, and sklearn.
In order for WIT to be usable for all practitioners, WIT has the ability to accept any python function that performs model predictions. This function can return more information than just model prediction scores, such as feature attributions, as shown later in this tutorial.
Custom Prediction Function API
The interface of the custom prediction function you must provide to WIT is slightly different based on whether you are using WIT inside of a notebook or in TensorBoard.
In both cases, one input to the function is the list of datapoints on which to perform prediction. These datapoints will be provided in the same format as loaded into WIT. So if you loaded WIT with tf.Example protos, then this function will be passed a list of tf.Example protos. If you loaded WIT with JSON dictionaries, then this function will be passed a list of JSON dictionaries.
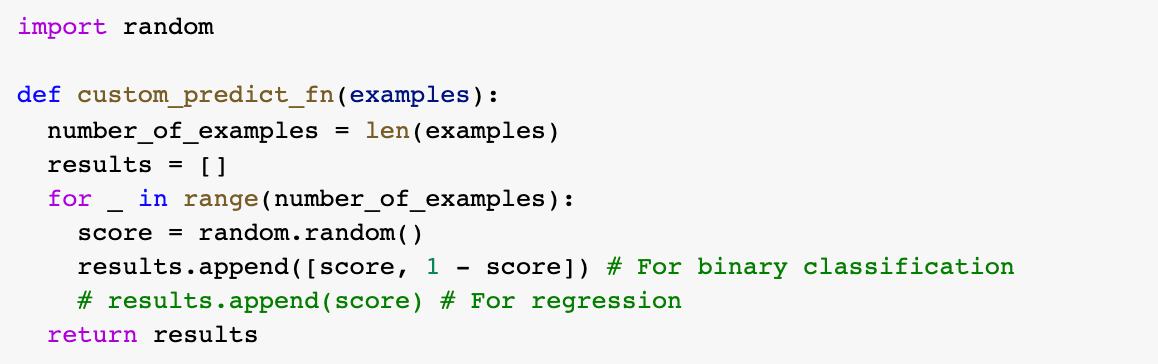
In both cases, the output of the function can be a list of model predictions, with a single element for each datapoint passed to the function. For regression models, the list element should contain just a single number. For classification models, the list elements should contain lists which represent the class scores for all classes outputted by the model. So, for a binary classifier, each returned list item is a list of length 2, with the first element being the class score for class 0 and the second element being the class score for class 1.
When using a custom prediction function in a notebook, the list of datapoints is the only function input. If comparing two models in WIT, you provide a separate custom prediction function for each model through the set_custom_predict_fn and set_compare_custom_predict_fn methods on the WitConfigBuilder object.
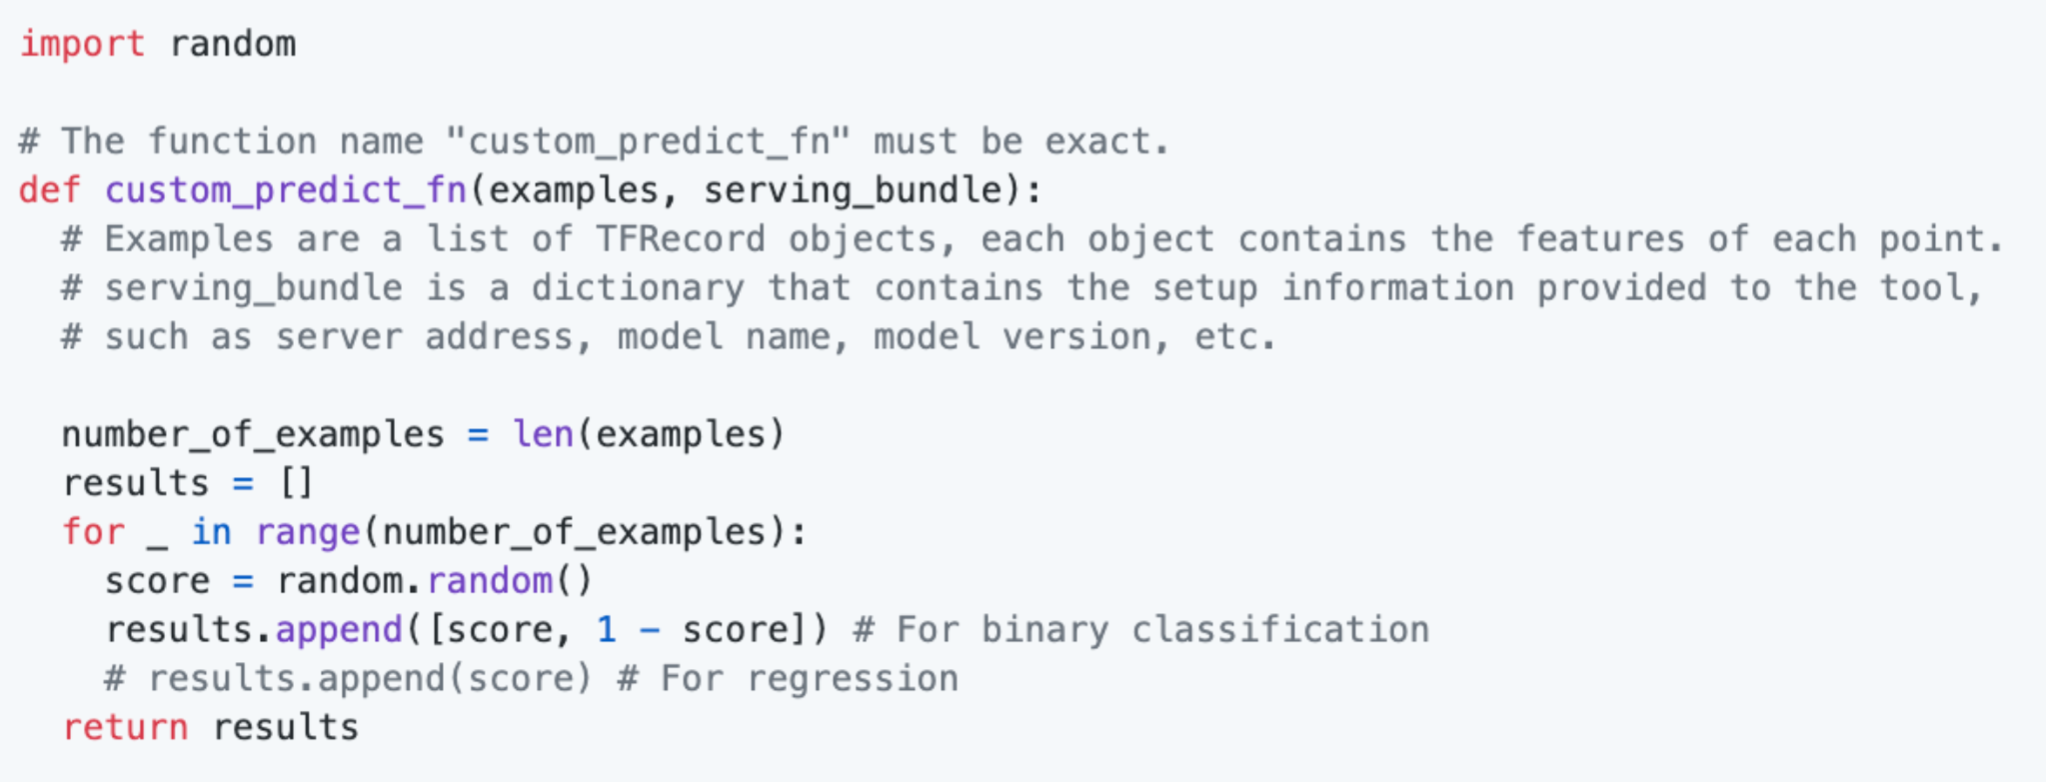
When using a custom prediction function in TensorBoard, there is a second function input: the ServingBundle object, as defined in utils/inference_utils.py. This object contains the information about the model, such as the model type, model name, and inference address, which a user provides on the WIT setup dialog when used inside of TensorBoard. This can be used to determine which model to perform inference on, in the case of using WIT to compare two models with custom prediction functions in TensorBoard.
Custom prediction functions can also return extra information that WIT will use to enhance its capabilities. The below sections explore returning feature attributions and returning other extra outputs from the model.
Attributions
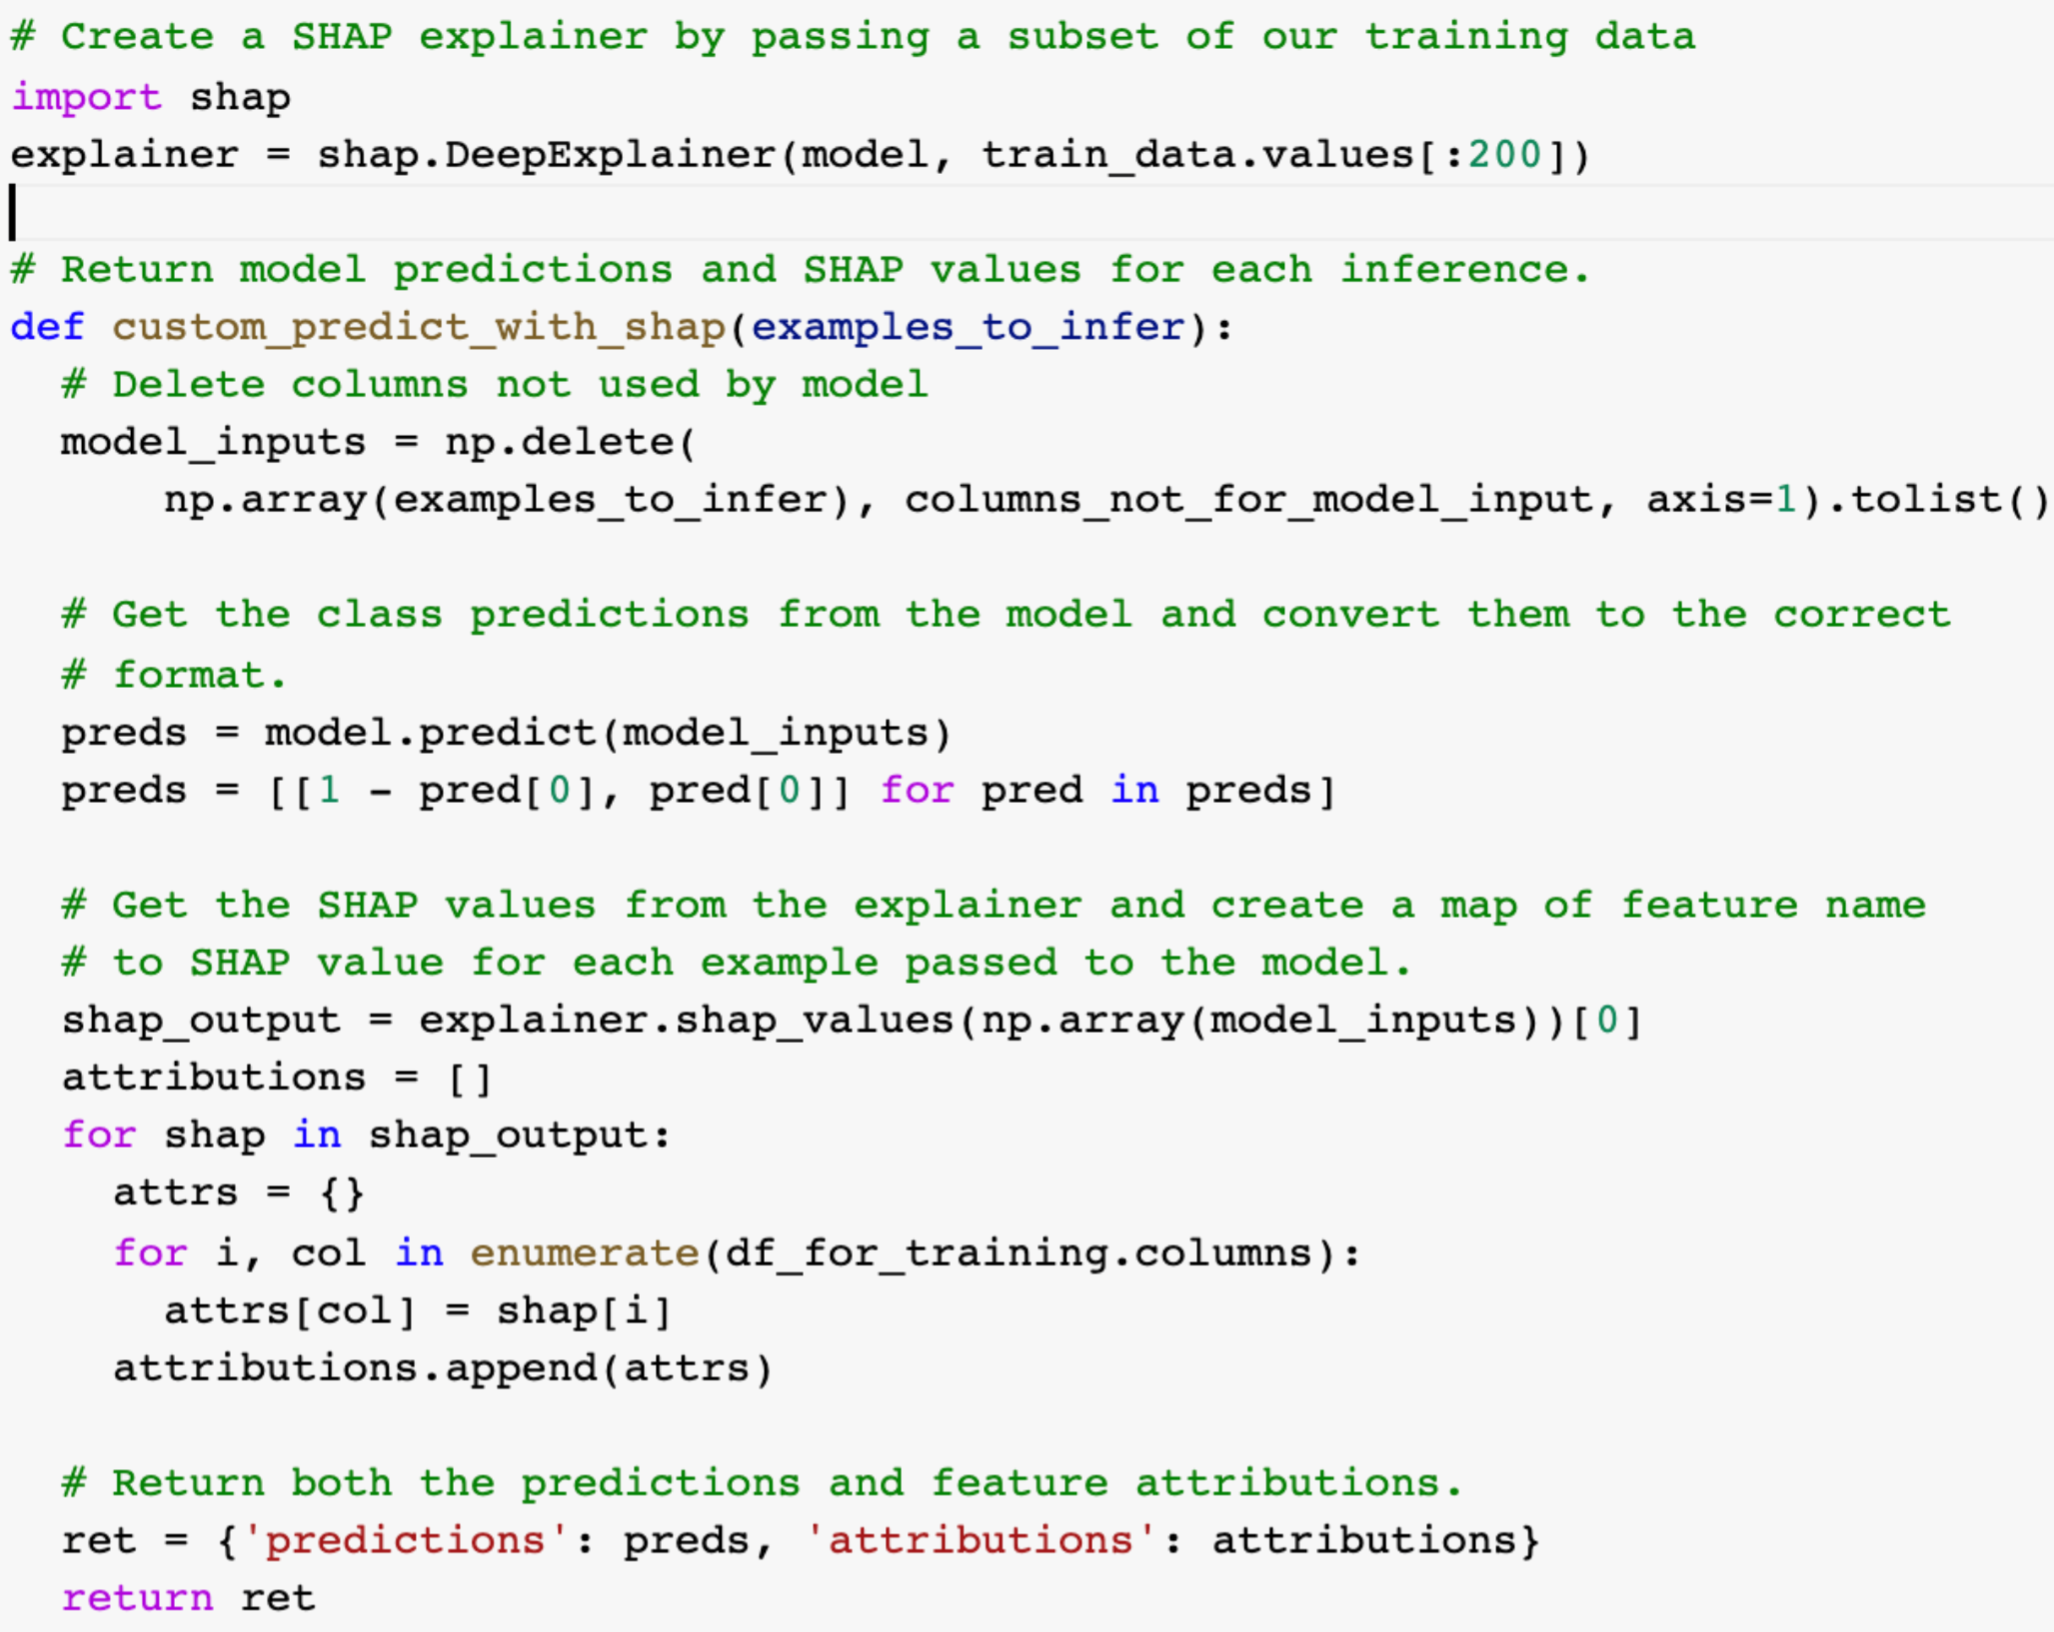
Exploring feature attributions is a great way to understand what features a model is relying on when making a prediction. Many techniques exist to get feature attributions from a model’s predictions, such as LIME, integrated gradients, and shapley values. WIT allows users of custom prediction functions to return feature attributions from any of these techniques along with model predictions, and then uses those attributions to enhance its visualizations.
To do this, instead of returning a list of scores from the custom prediction function, the function should return a dictionary, where the predictions list explained in the previous section is stored under the key predictions, and the attributions are stored under the key attributions. The attributions should also be a list with one entry per datapoint. Each entry should be a dictionary with the keys being the names of the input features to the model (matching the features in the input data), and the values being the attribution scores for those features for the specific datapoint. For single-valued features (where each feature contains a single value as a number or string), the attribution should be a single number for that feature. For multi-valent features, such as can be specified in a tf.Example feature value list, the attribution for that feature should be a list with an attribution score for each feature value in the input datapoint. This notebook shows a custom prediction function doing binary classification with a keras model and using the shap library to generate feature attributions.
When attributions are returned along with predictions, new visualizations are enabled in WIT. These visualizations are described in the tutorial “Exploring Attributions in the What-If Tool”.
Extra Outputs
Custom prediction functions can return arbitrary prediction-time information for each datapoint. This can be useful in the case that you can calculate an additional metric per-datapoint at prediction time and wish to display it in the What-If Tool. One example of this could be a score calculated for each datapoint at prediction time for how similar each datapoint is to some anchor datapoint or concept, according to the internals of the model (see the TCAV paper for one example of such a metric). To do so, have the custom prediction function return a dictionary, where the predictions list is stored under the key predictions, as described in the previous section. Any other metric can be included by adding an additional key (this key will be used to display the metric) to the dictionary, and having its value be a list with one entry for each datapoint provided to the custom prediction function. The list entry should be a single number or string for display in the tool.
Any returned metrics will be listed in the datapoint viewer in the Datapoint Editor, just like the feature values area, and also usable for creating charts in the datapoints visualization, and for slicing datapoints in the Performance workspace.


