Relationship Between Cost Ratio and Thresholds
The ROC Curve, one of the most used and recognized graphs to compare classifier performances, provides insight on how performant a model is in predicting classes. By evaluating the true positive and false positives rates across different threshold values, the ROC Curve serves as a useful diagnostic tool in deciding which threshold value to use at inference time.
However, one of the shortcomings of the ROC Curve is that it assumes equal costs for both false negatives and false positives. There can be scenarios where a model missing a positive label is worse than incorrectly classifying an example as a negative label. This is particularly an issue for imbalanced classification problems where the number of datapoints for each label is not balanced to begin with. As such, because the ROC Curve uses the assumption of equal costs for all misclassified instances, its result cannot be generalized across all outcomes.
For example, perhaps you are working on a model that uses data acquired from several tests to help determine if a patient who was just admitted into a hospital should be placed in an intensive care unit (ICU) or not. Now, if a patient who needs to be placed in ICU is instead placed in a regular room (in other words, a false negative), then this may endanger their life. On the other hand, if a patient who does not need to be assigned to the ICU gets assigned to one (in other words, a false positive), then this may cause a large unnecessary expense to the patient.
In this example, depending on the reason why a patient was admitted into a hospital, you could argue that a false negative is worse and more costly than a false positive.
In your work, make sure that you make a responsible decision about the tradeoffs between false positives, false negatives, true positives, and true negatives. You may want a very low false positive rate, but a high true positive rate. Or you may want a high precision, but a low recall is okay, too.
Choose your evaluation metrics in light of your desired tradeoffs.
Since equal error costs are very rare in the real-world, the What-If Tool provides the ability to adjust the cost of misclassification as a criterion to help decide which threshold value to select. This ability, called the Cost Ratio, is defined as the relationship between the cost of a false positive and the cost of a false negative. Found in the Configure panel of the Performance & Fairness, the Cost Ratio is required by the What-If Tool for binary classification models to optimize the classification thresholds when using the optimization strategy controls.
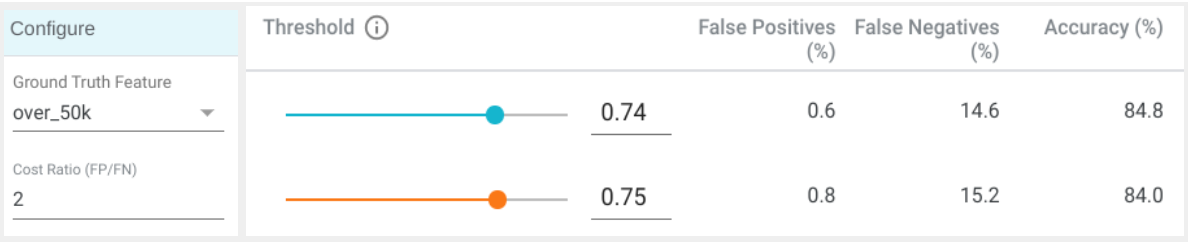
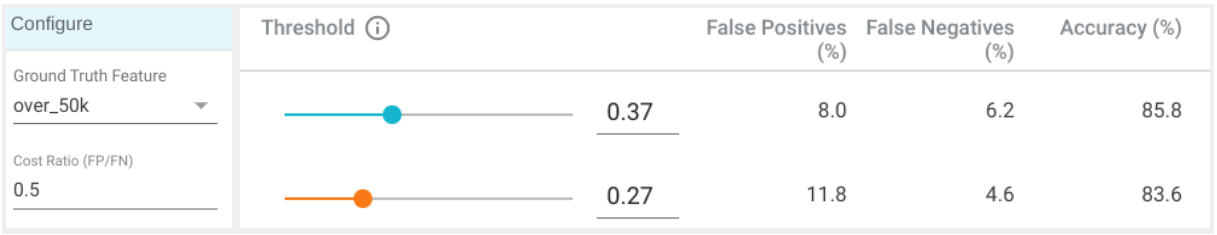
Changing the Cost Ratio affects classification thresholds and performance results. By default, the Cost Ratio is set to 1.0, at which false positives and false negatives are considered equally undesirable. As you increase the Cost Ratio, false positives produced by a model will be most costly than false negatives. Conversely, as you decrease the Cost Ratio, false negatives produced by a model will be more costly than false positives.
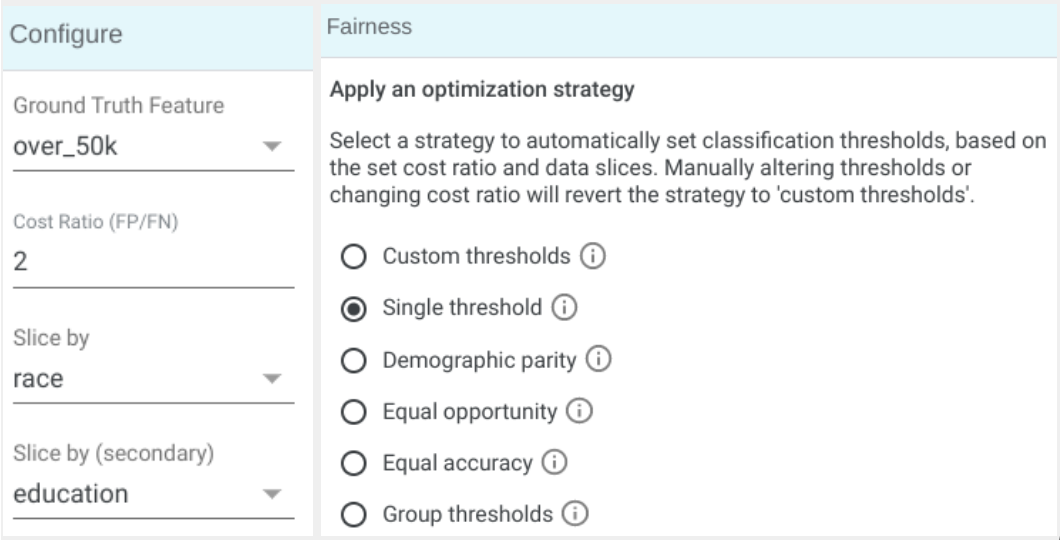
After adjusting the Cost Ratio, apply an optimization strategy in order for the What-If Tool to appropriately apply changes to the decision-making threshold. The ptimization strategy can be set in the Fairness panel, just below the Configure panel.
The consequences of models making errors may differ depending on their underlying context. Even within a model, each type of error may have a different consequence that can not be evaluated equally. While the What-If Tool does not have the metadata of every exact severity of any misclassified instance in, it does provide the ability to modify the Cost Ratio to help offset the often imbalance nature of error metrics, visualizing a wider range of uncertainty.


