Understanding Performance Metrics For Classifiers
While evaluating the overall performance of a model gives some insight into its quality, it does not give much insight into how well models perform across groups nor where errors truly reside. To better understand the outcomes of a model, the What-If Tool provides a confusion matrix for comparing the prevalence of different types of model results.
A confusion matrix illustrates the match and mismatch between the prediction of the model(s) and the corresponding actual outcomes. This is accomplished by keeping count of all the times the model(s) succeeded and failed in predicting the outcome with respect to the ground truth. These outcomes are then placed in a contingency table that summarizes the relationship between Predicted (what the model says) and Actual (what the ground truth says) outcomes.
Available only for classification-type models, the What-If Tool automatically generates a confusion matrix table, located in the Playground section of the Performance & Fairness workspace:
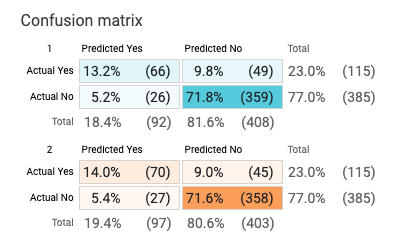
In this example, the confusion matrix is depicting the outcomes of two binary classification models trained using the same dataset: a linear (blue) and a deep neural net model (orange). Both models are tasked to predict whether someone is likely to earn more than $50,000 in annual salary based on data from the US Census.
In this context, what is "Yes" in "Predicted Yes" or "No" in "Actual No" depends on the provided label associated with the outcome. Here, an income >$50,000 is labeled as Positive ("Yes"), and an income ≤$50,000 is labeled as Negative ("No"). In cases where the model makes the correct prediction ("Predicted Yes" and "Actual Yes", or "Predicted No" and "Actual No") are classified as True, and cases where the model makes the wrong prediction ("Predicted Yes" and "Actual No", or "Predicted No" and "Actual Yes") are classified as False.
As such, the confusion matrix in the What-If Tool captures the following states:
| Result | Model Output | Ground Truth | Confusion Matrix Prediction Entry | Confusion Matrix Ground Truth Entry |
|---|---|---|---|---|
| True Positive | Model Predicts >$50,000 | Ground Truth >$50,000 | Predicted Yes | Actual Yes |
| True Negative | Model Predicts <=$50,000 | Ground Truth <=$50,000 | Predicted No | Actual No |
| False Positive | Model Predicts >$50,000 | Ground Truth <=$50,000 | Predicted Yes | Actual No |
| False Negative | Model Predicts <=$50,000 | Ground Truth >$50,000 | Predicted No | Actual Yes |
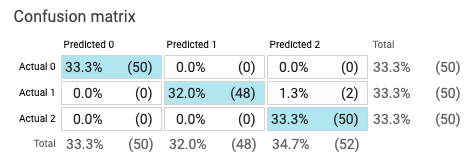
The What-If Tool can also expand the confusion matrix for multi-classification cases:
With these outcomes computed, the What-If Tool then calculates a variety of performance metrics that take the values from the confusion matrix as input to describe more generally what is happening with the model. These performance metrics include the following:
| Evaluation Metric | Formula | Question Answered |
|---|---|---|
| Precision | True Positives / (True Positives + False Positives) | How often does the model correctly predict the positive label? |
| Recall | True Positives / (True Positives + False Negatives) | Out of all the available positive labels, how many did the model correctly identify? |
| Accuracy | (True Positives + True Negatives) / Total Number of Datapoints | How often does the model correct predict any label? |
| F1 | 2 x (Precision x Recall) / (Precision + Recall) | In summary, how well does the model perform? |
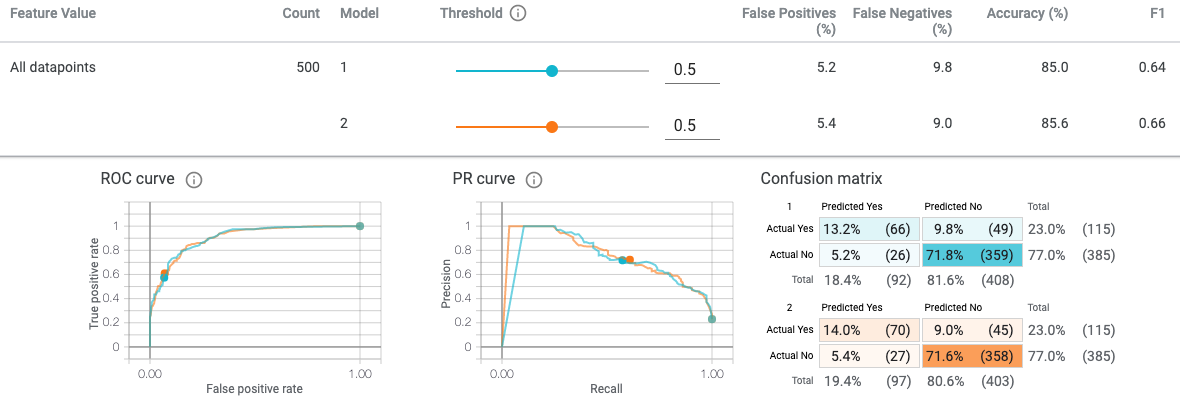
These performance metrics are displayed beside (Precision, Recall) or above (Accuracy, F1) the confusion matrix in the same Playground:
In addition to comparing performances between two models, the What-If Tool, with its Slice by option in the Configure module, offers the capability of producing a confusion matrix and associated metrics for any group in the dataset that can be defined by a single feature’s values or a cross of two features.
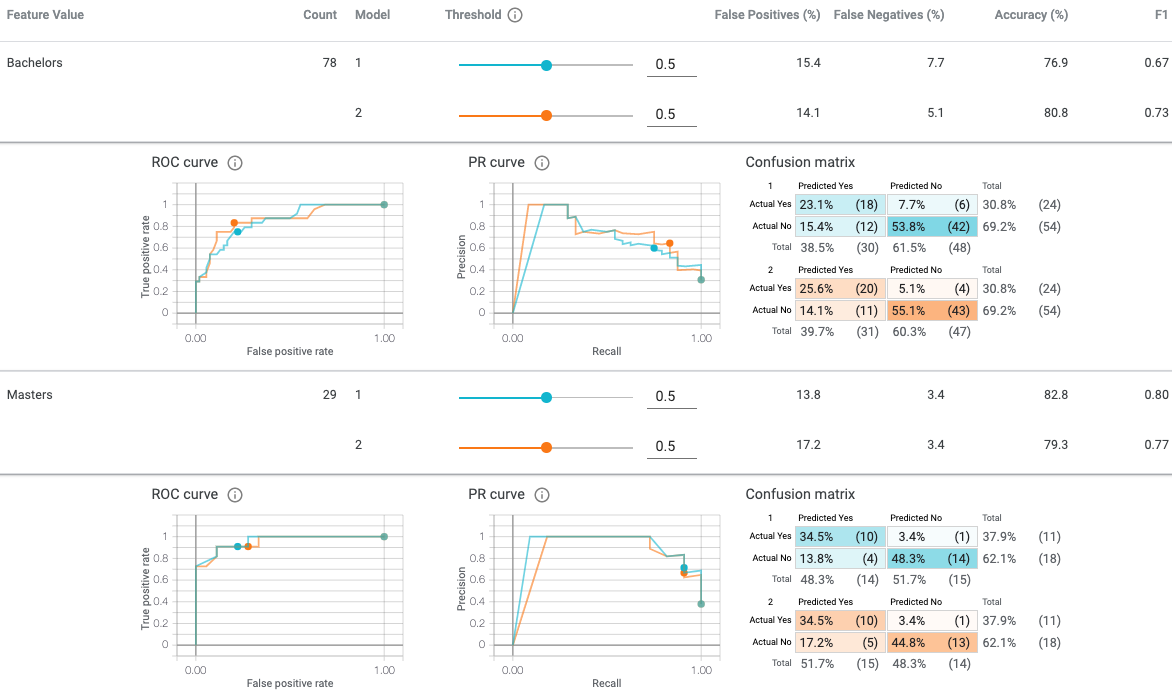
In this running example, exploring the performance metrics with respect to Education might reveal where the model overperforms and underperforms, as well as how represented these groups are in the dataset.
While it may seem daunting at first, this level of information is needed to better understand the relationship between performance metrics and desirable outcomes. The What-If Tool provides such interactive visualizations without additional overhead to make it easier to ask questions about model performances.


