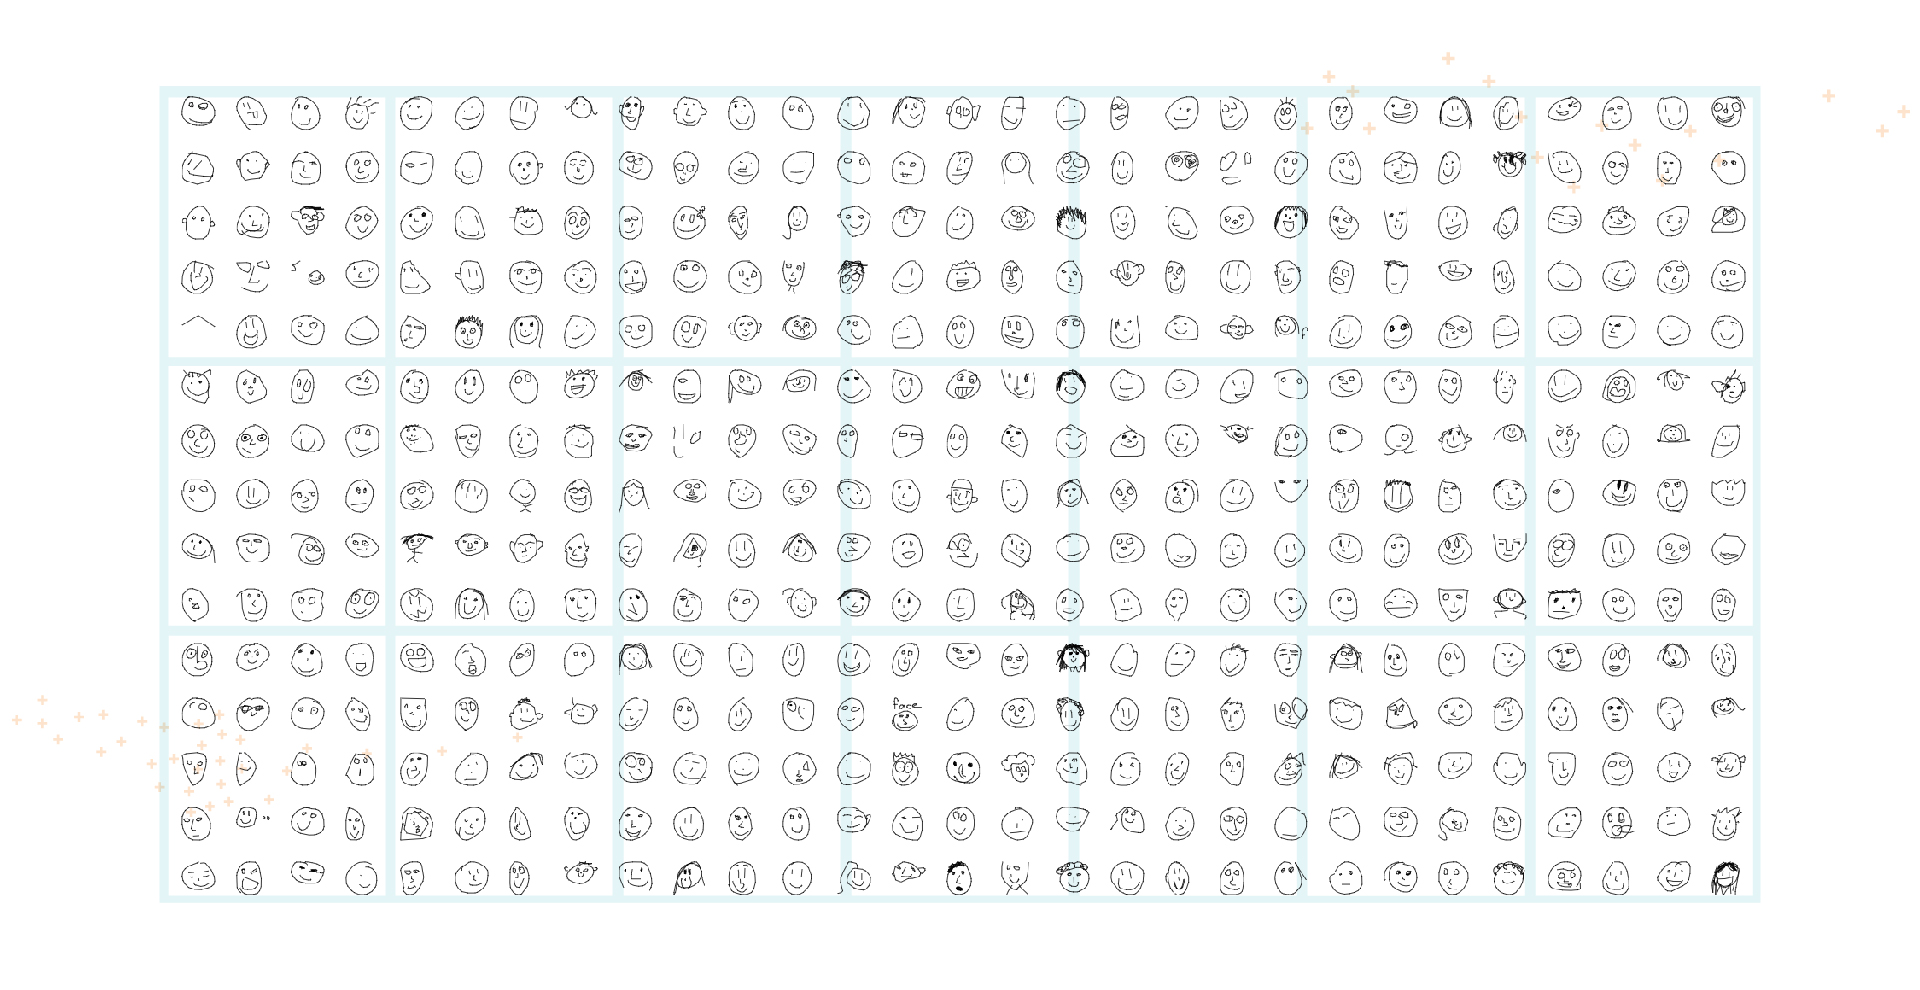
Facets - know your data
Better data leads to better models.
The power of machine learning comes from its ability to learn patterns from large amounts of data. Understanding your data is critical to building a powerful machine learning system.
Facets contains two robust visualizations to aid in understanding and analyzing machine learning datasets. Get a sense of the shape of each feature of your dataset using Facets Overview, or explore individual observations using Facets Dive.
Explore Facets Overview and Facets Dive on the UCI Census Income dataset, used for predicting whether an individual’s income exceeds $50K/yr based on their census data. The census data contains features such as age, education level and occupation for each individual.1
Facets Overview
Overview takes input feature data from any number of datasets, analyzes them feature by feature and visualizes the analysis.
Overview gives users a quick understanding of the distribution of values across the features of their dataset(s). Uncover several uncommon and common issues such as unexpected feature values, missing feature values for a large number of observation, training/serving skew and train/test/validation set skew.
Facets Overview summarizes statistics for each feature and compares the training and test datasets. It becomes easy to learn the distribution of values across the 6 numeric and 9 categorical features for both datasets.
Use the “Sort by” dropdown to sort features by “Distribution distance”. This sort order brings to the top of the tables, the features that are the most different between the two datasets. “Target” becomes the first feature in the table of categorical features. The chart for this feature shows that the training and test datasets actually use slightly different labels (“>50K” for the training data and “>50K.” for test data - notice the trailing period). This helps us uncover an unexpected difference between the training data and the test data.
Load one or more csv files with your first row being the header.
Facets Dive
Dive is a tool for interactively exploring large numbers of data points at once.
Dive provides an interactive interface for exploring the relationship between data points across all of the different features of a dataset. Each individual item in the visualization represents a data point. Position items by "faceting" or bucketing them in multiple dimensions by their feature values. Success stories of Dive include the detection of classifier failure, identification of systematic errors, evaluating ground truth and potential new signals for ranking.
The Dive visualization shows each individual item in the training dataset. Clicking on an individual item reveals key/value pairs that represent the features of that record; values may be strings or numbers.
Using the menus on the left, you can change how the data is organized in order to gain insight into the dataset. Use the “Faceting” menu to do Row-based faceting” by “Education-num”. Use the “Color” menu to color by “Target”. This will show how higher levels of education are related to whether or not an individual earns more than $50K/yr.
Load one or more csv files with your first row being the header.
References
Lichman, M. (2013). UCI Machine Learning Repository [http://archive.ics.uci.edu/ml/datasets/Census+Income]. Irvine, CA: University of California, School of Information and Computer Science
Quick, Draw! Dataset has been made available by Google, Inc. under the Creative Commons Attribution 4.0 International license.
